A real-time, anonymous mental health monitoring system
Description
A wearable and app for mental health monitoring.
My Role
Product Designer
Timeline
3 Months
Background
In my first semester of M.A Visual and Experience Design, our class was given a brief on Data Mirror. Data Mirror is a very abstract term and students had to come up with their understanding of Data Mirror and make solution/project based on that. I decided to tap into the space of mental health and worked on a system which gives user in-depth understanding of their mental health while being completely anonymous.
The Data Mirror is a lens through which we can perceive a different and more nuanced version of ourselves rather than merely a reflection of our data.
The Data Mirror elevates our interaction with personal data, transforming it into a profound exploration of self. It’s not just an aggregation of data points; it’s a deep-dive into our personality, behaviors, and patterns, moving beyond traditional analytics to uncover insights that aren’t immediately obvious. This concept provides a rich, nuanced view of ourselves, enriched by the depth of our digital footprints, and challenges us to think beyond the surface. It’s a journey into self-awareness, using our data to reveal hidden facets of our identity, offering a comprehensive understanding of our subconscious preferences and behaviors. The Data Mirror is an introspective, revealing, and transformative tool, bridging the gap between our perceived self and the complex, data-informed insights into who we truly are.
Problem Space
The concepts of slow food and living are integral to human heritage, spanning from prehistoric times to modern eras, with traditions ranging from Egyptian home gardens to Philippine rice terraces. While historically rooted in self-sufficiency, the march of industrialisation and urbanisation shifted our food sources from local to global, transforming agriculture into an expansive network where, for instance, a Spanish farmer might grow tomatoes for someone in California.
Privacy
The online sharing of personal information, including details about mental health, has sparked concerns regarding data security and privacy
Anonymity
For some individuals, discussing their problems anonymously can provide a sense of safety and openness that may be hindered by societal stigmas
Awareness
For some individuals, discussing their problems anonymously can provide a sense of safety and openness that may be hindered by societal stigmas
User Persona
“Anna” is a 25-year-old graduate student who is currently in the midst of her PhD program. She is feeling overwhelmed and stressed due to the demands of her coursework, as well as the pressure to publish her research. She is hesitant to seek help from a therapist or counselor due to the stigma associated with mental health, and fears that it could impact her academic and professional future. She is looking for a discreet and confidential way to monitor her mental health and receive support when needed.
“Joe” is a 35-year-old working professional who has been dealing with episodic stress for several weeks. He has tried various forms of DIY home therapies, but has not found a solution that works for him. He is looking for a more comprehensive and personalized approach to his mental health, one that allows him to track his progress over time and make informed decisions about his treatment. He is also looking for a system that allows him to maintain his privacy, as he is concerned about how his mental health issues might be perceived by his colleagues and friends.
Concept
Patch
The transparent patch is the wearable which would be worn by the users and would be responsible for collecting and transmitting the data to the app which would include various sensors
App
The app would provide several features to support users in their mental health journey, like tracking of physiological responses such as heart rate, brain activity and other physiological responses
Functionality
The transparent patch would be worn by the users and would be responsible for collecting and transmitting the data to the app. It would include various sensors such as: All these data would be analysed by the app and machine learning algorithms to determine the user’s mental health.
HRV
Cortisol levels
Skin conductance
Brain activity
Location
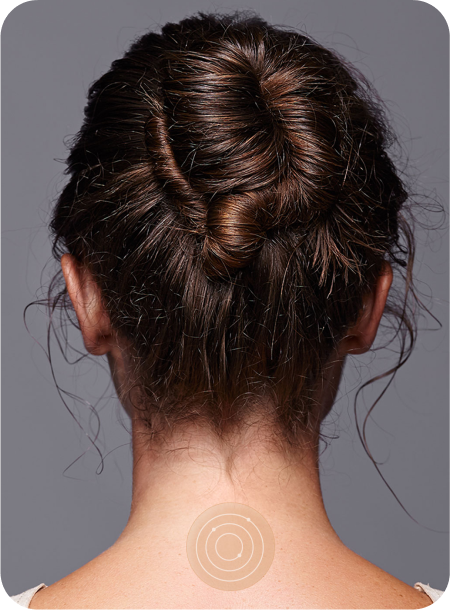
The transparent skin patch can be sticked at the back of the neck, specifically on the skin area known as the occipital region. This is the area at the base of the skull, which is rich in blood vessels and has a high concentration of nerve endings. This makes it an ideal location for the patch to collect physiological data such as brain activity, heart rate, and other physiological responses.
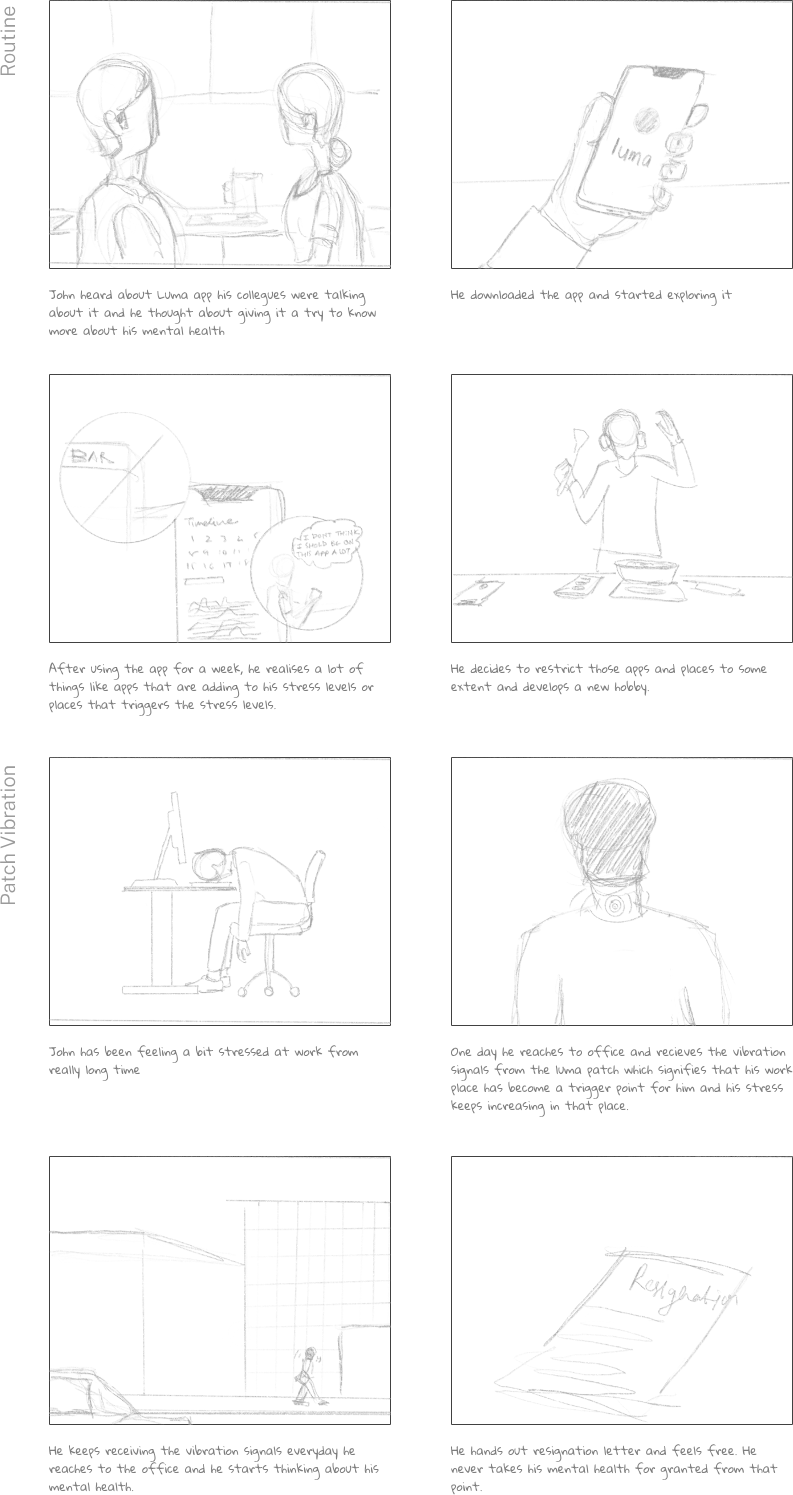
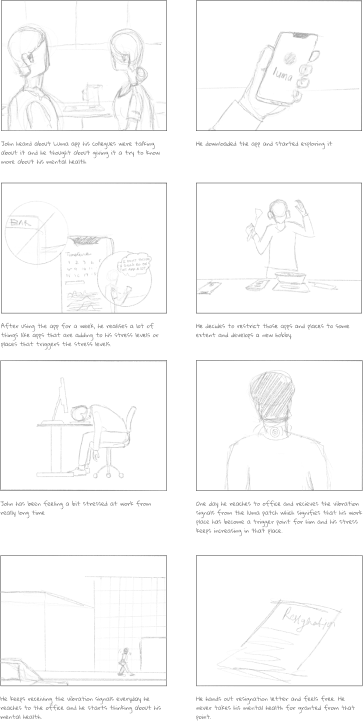
Story Board
I also crafted a storyboard to illustrate how the app and patch will significantly impact the user’s daily life, offering insights into their physical and mental well-being. This visual guide demonstrates how our technology provides personalised data, fostering a better understanding of their health patterns and supporting informed decisions for improved life quality.
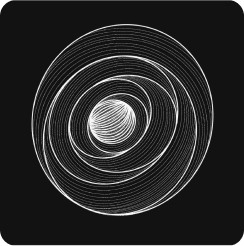
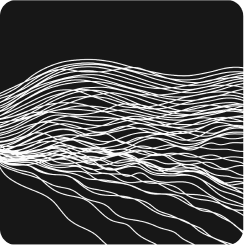
Data Visualisation
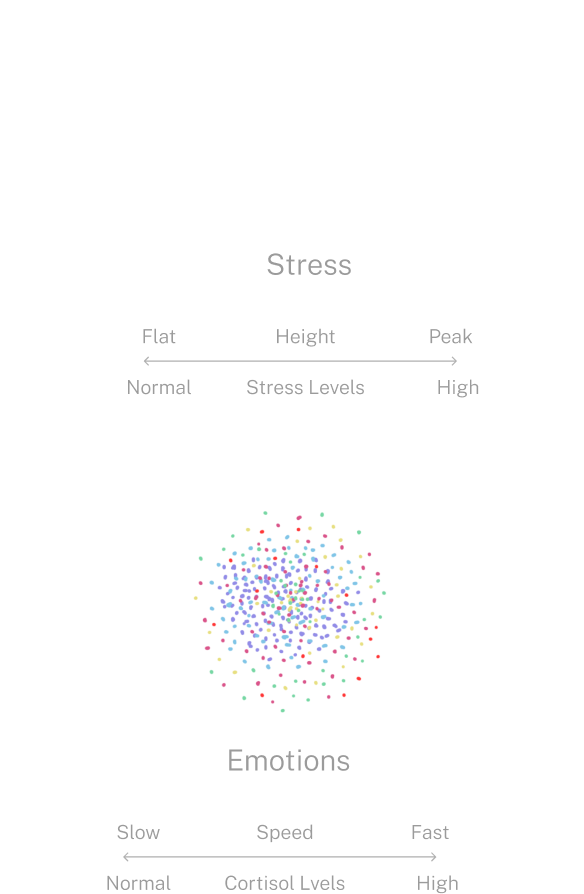
I began designing this data visualization with the objective of making the abstract and often elusive aspects of our internal experiences tangible and visually interpretable. By mapping out emotional states and stress levels in an engaging and accessible format, this tool aims to translate the nuances of our daily mental health into a format that is not only easy to understand but also compelling in its representation, potentially offering a new avenue for individuals to connect with and understand their own patterns of mental well-being.
Joy: includes happiness, ecstasy, elation, pleasure, triumph, satisfaction, contentment, pride, and serenity
Surprise: includes amazement, distraction, wonder, awe, amusement, shock, speechlessness, and disbelief
Trust: includes safety, vulnerability, hopeful, positive, secure, supported, comfortable, and relaxed
Anticipation: includes interest, vigilance, excitement, awareness, impatience, expectant, harried, and cautious
Sadness: includes grief, pensiveness, regret, hurt, rejection, melancholy, discouragement, and depressed
Disgust: includes hatred, disinterest, disapproval, revulsion, dismissiveness, repulsion, and critical
Anger: includes rage, irritation, frustration, insulted, bitterness, mocked, violated, jealous, offended, and provoked
Fear: includes terror, caution, apprehension, concern, worry, anxiety, stressed, and nervous
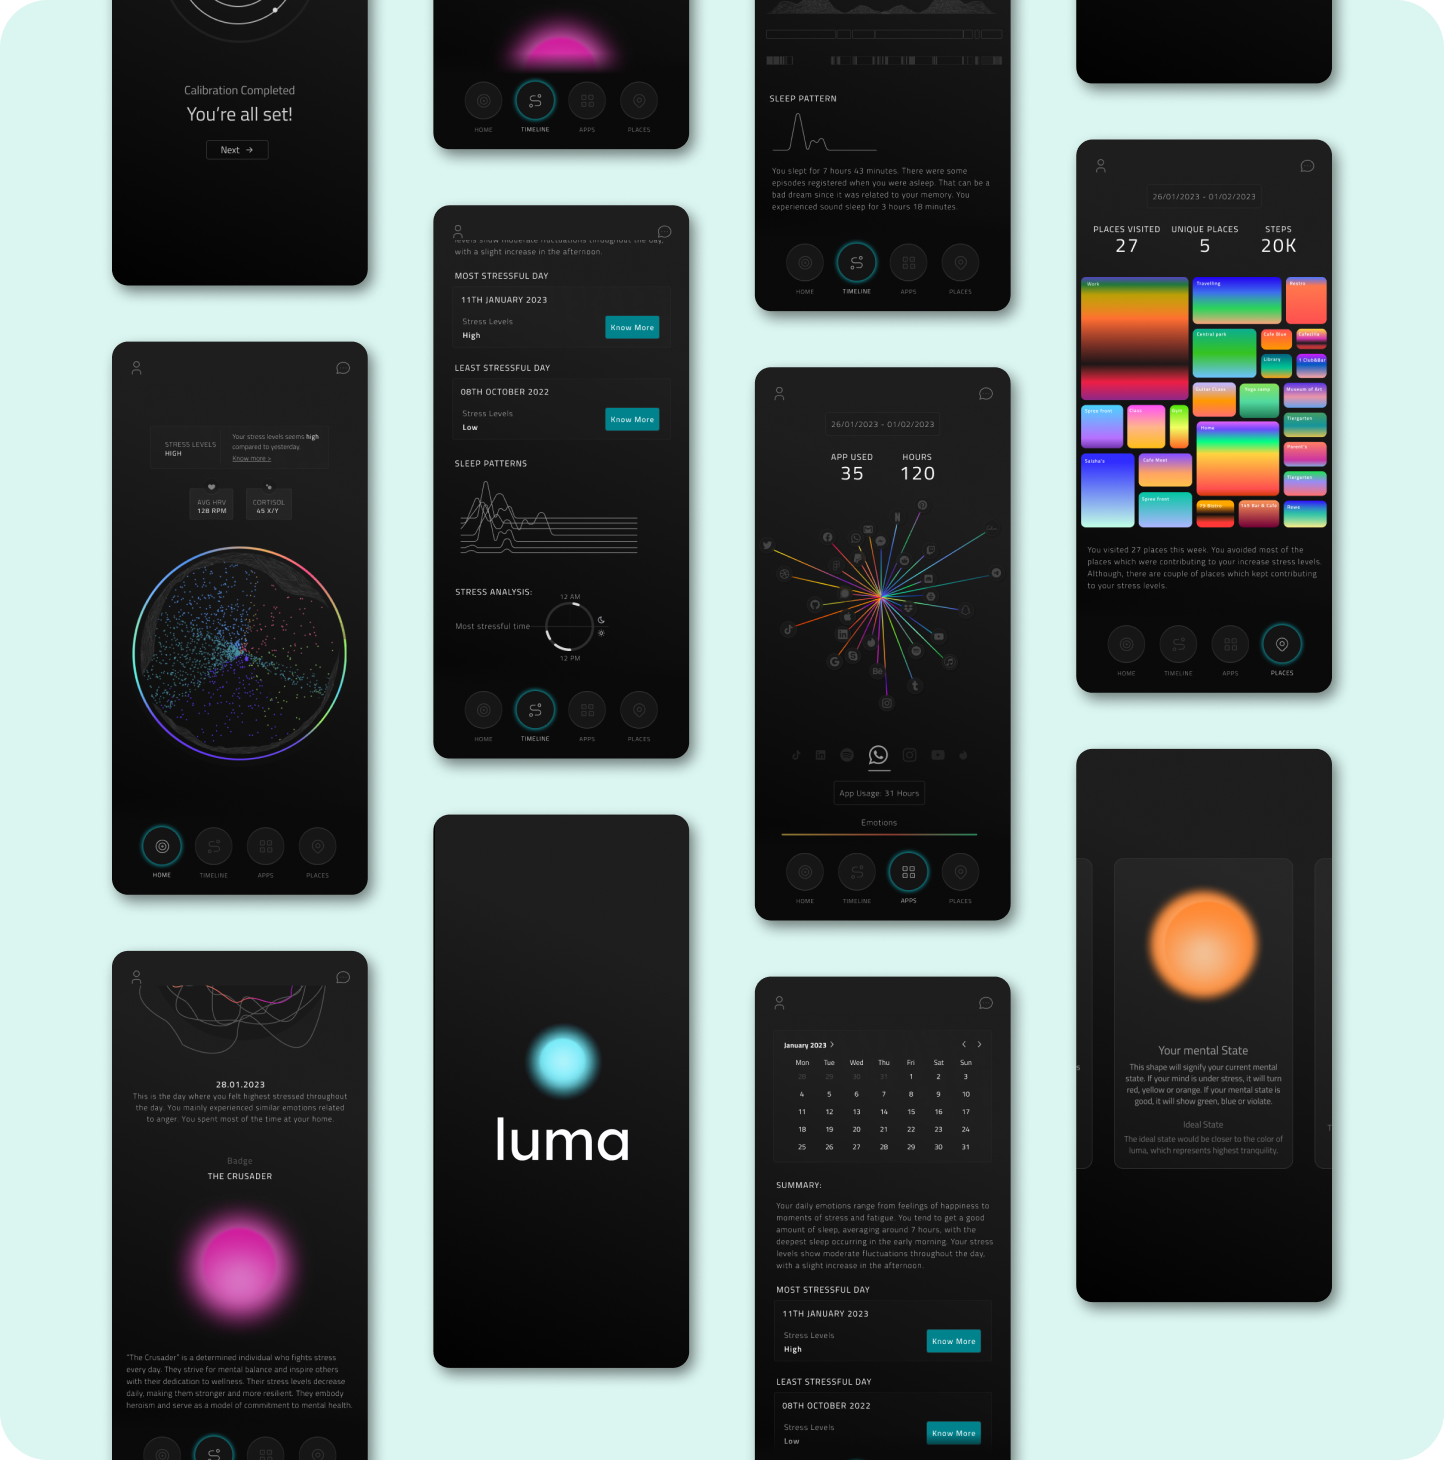
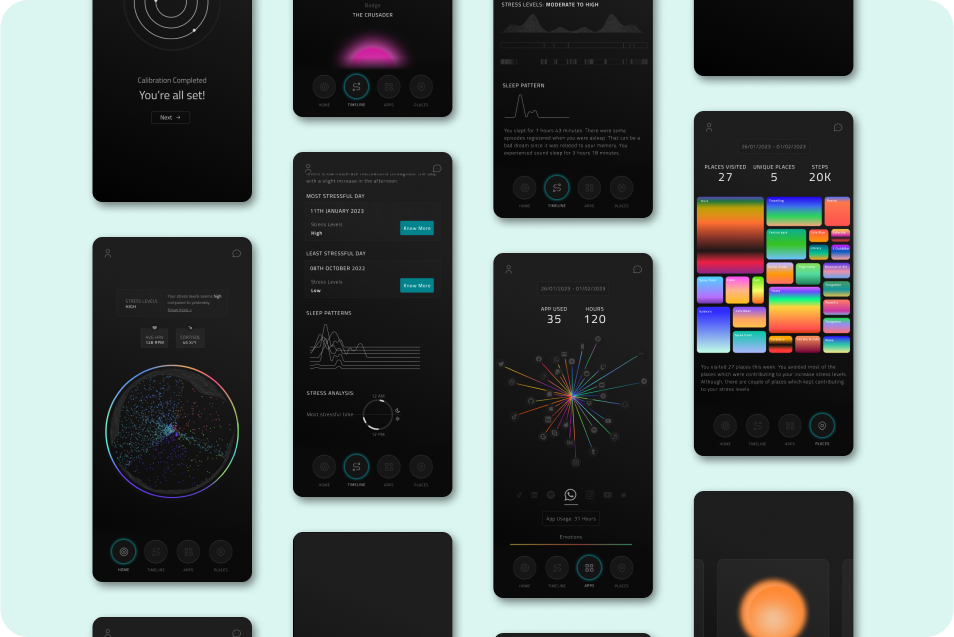
Home
Onboarding and
Main Dial
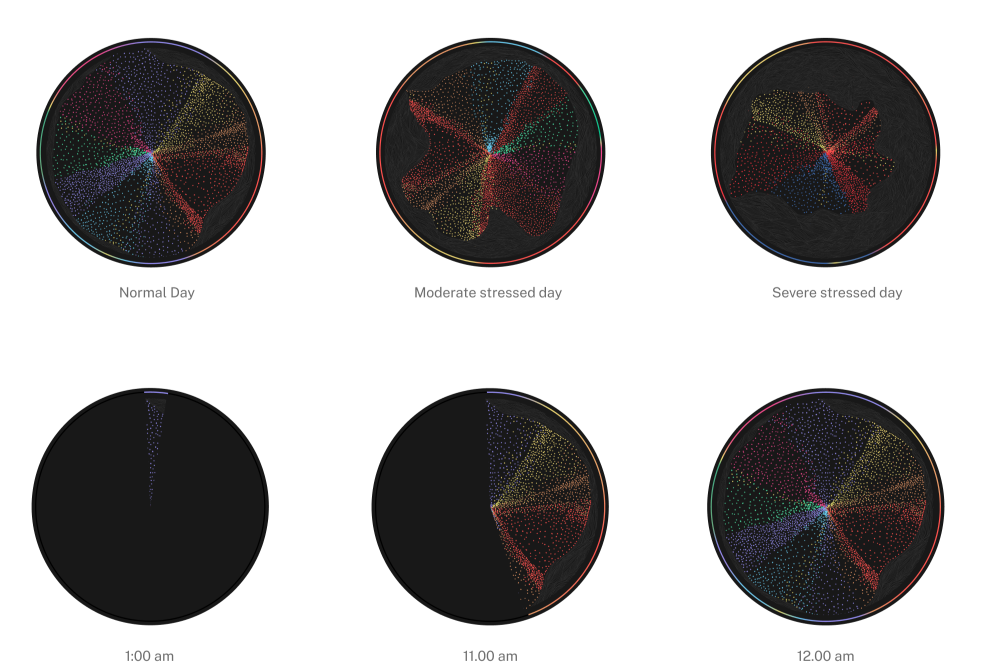
When users first launch the app, they’re gently introduced to its array of data visualisations, ensuring they’re comfortable navigating the interface. The home tab has been stripped down to essentials for clarity, featuring a solitary, prominent gauge that reflects the user’s emotional state as it ebbs and flows throughout the day. A simple press on the gauge’s perimeter allows the user to peek into their stress levels at particular times, marrying simplicity with deep personal insight.
Timeline
In-depth understanding of each day
The ‘Timeline’ tab offers users a clear snapshot of their day-to-day and monthly data, allowing them to track and reflect on their sleep cycles and distinguish between more relaxed and more stressful days within a month. To add an element of encouragement, users receive badges based on their personal progress, acting as motivational tokens in their mental health journey.
Apps & Places
Stress levels in digital and physical places
The ‘Apps’ and ‘Places’ tabs delve into the user’s activities, providing summaries that showcase how they felt in specific locations or while using certain apps. This feature aids users in becoming more self-aware by highlighting the influences that different environments and applications have on their emotional well-being.
My learnings
Working on Luma was a transformative experience, pushing me to think outside the box. As the first project in my master’s program, I initially approached it with caution, carefully considering various possible solutions. This project was a significant learning curve, where I discovered the extensive possibilities unlocked by entertaining feasible solutions. I tried coding for data visualizations, adding animation to bring data to life, and I thoroughly enjoyed designing the app’s UI, developing a cohesive design system throughout the process. This journey was not just about building an app; it was about enhancing my UX design skills and expanding my creative and technical boundaries.